Tips and Tricks: Chrome Dev Tools
2020-10-29 by Adam Goth · 3 min read
I recently spent some time diving into all that Chrome's developer tools have to offer. It's quite impressive what the Chrome team has built to make the lives of web developers easier. In this post, I will share a handful of the nifty things I learned.
Let's jump in.
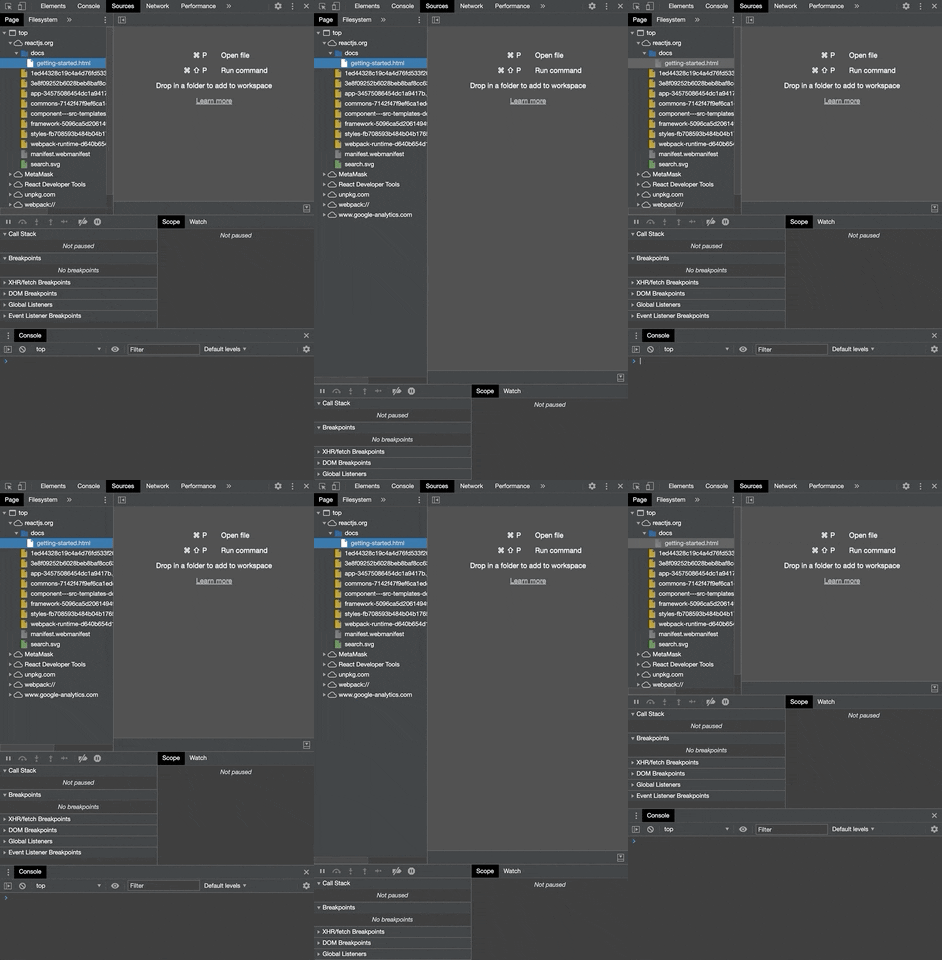
Toggle the console drawer
Most people are probably familiar with the
Console
tab. But you can open a console drawer from almost any other tab as well. This
can easily be toggled by simply hitting the esc key.
Toggle all nested elements
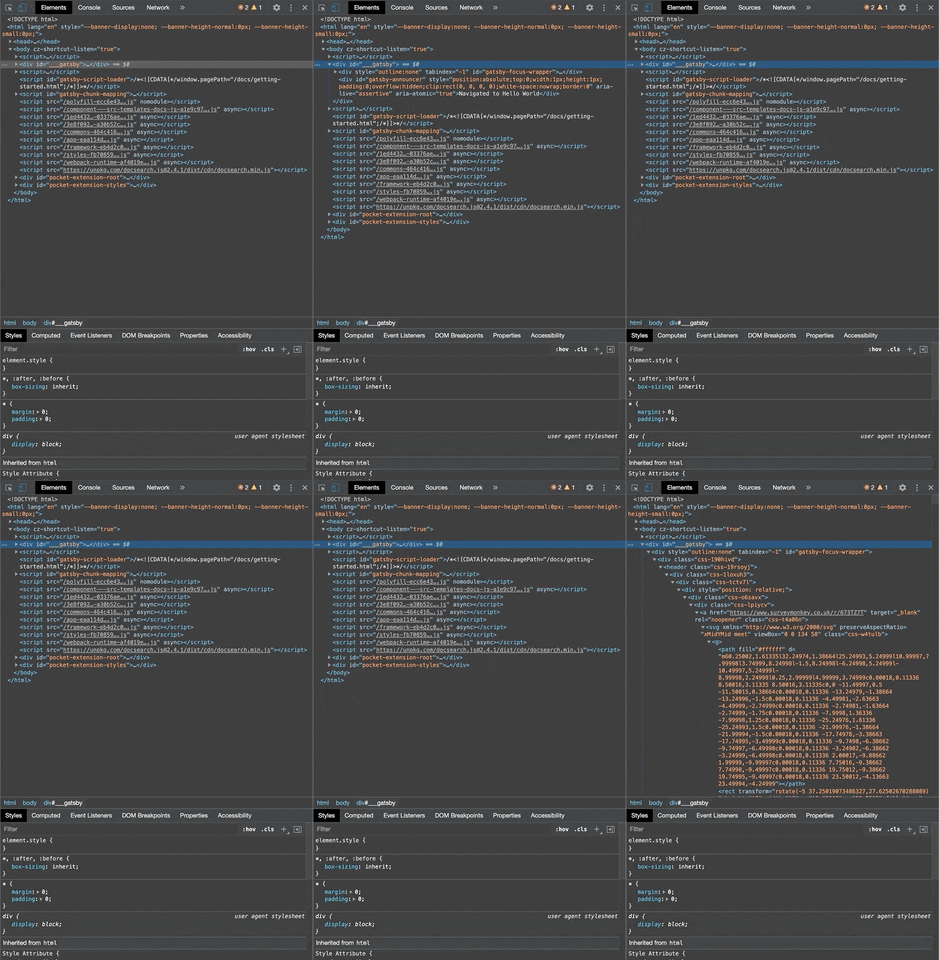
Clicking an element within the Elements tab will expand that particular element
and show you any children elements belonging to it. Sometimes, elements can be
nested several layers deep. By holding the option key while clicking an
element, you can expand all children nested within that element.
Scroll element into view
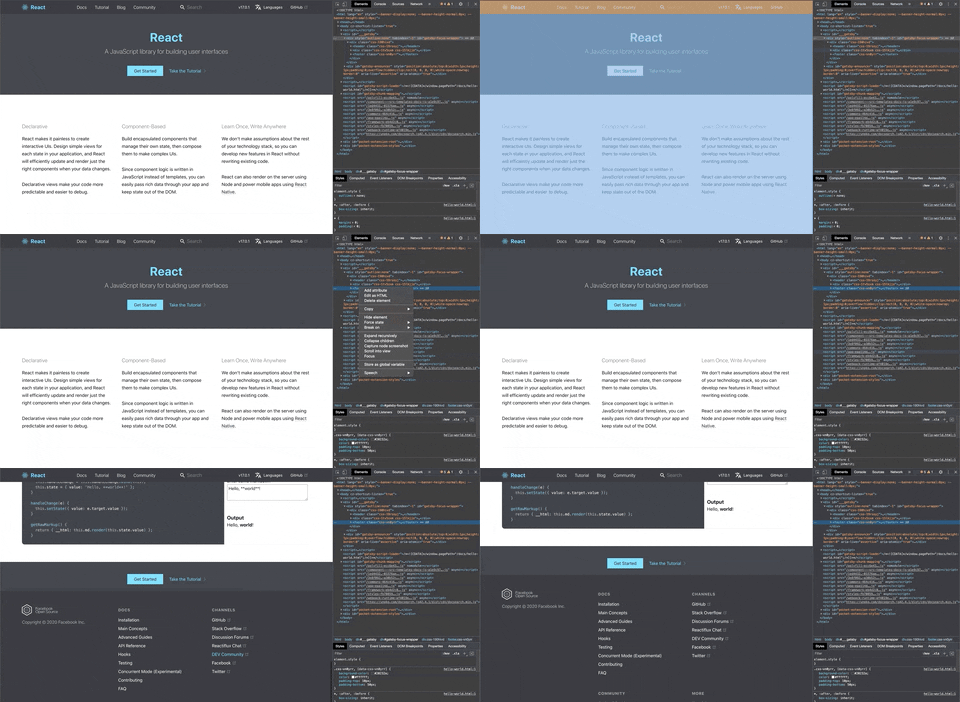
Sometimes you may see an element with your Elements tab and wonder where exactly that element lives on the page. Usually, you can see the element get highlighted on the page as you hover it in the Elements tab, but sometimes the element is not within the page view. If you right-click the element, you can choose the "Scroll into view" option and Chrome will do just that.
Toggle an element's visibility
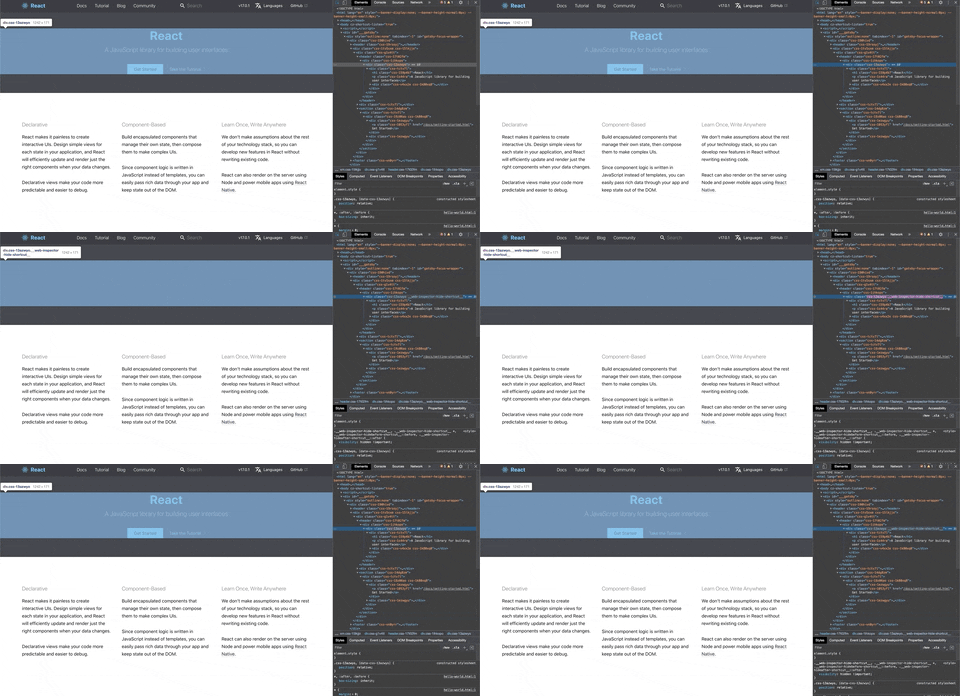
For whatever reason, you may want to toggle whether an element on your page can
be seen or not. This can easily be done by simply hitting the h key while the
element is selected in the Elements tab.
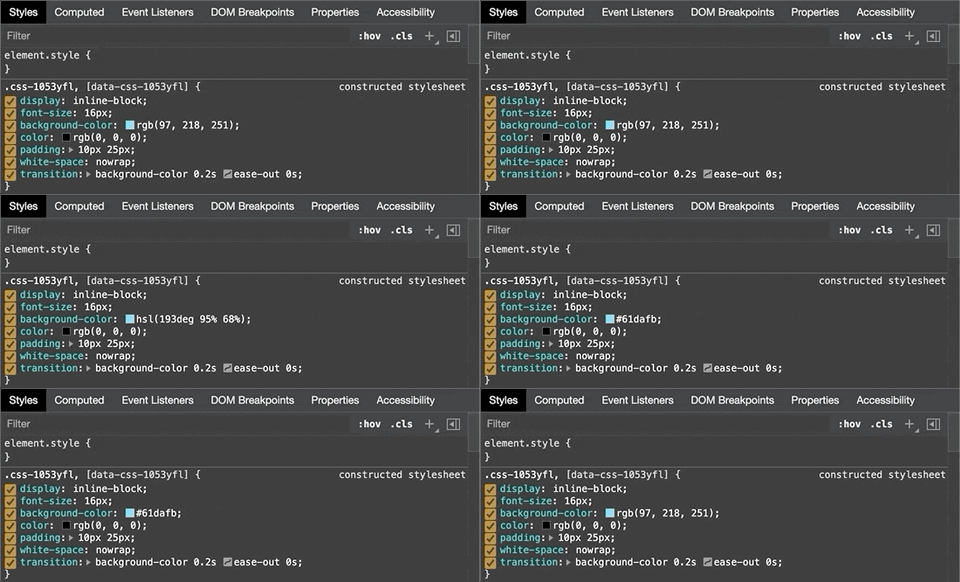
Converting color formats
When viewing an element's CSS color property in dev tools, you can toggle
between RGB, HSL, and hex color formats by holding the shift key and clicking
the color square. This can be convenient in various situations where you may
find a color in one format, but need it in another.
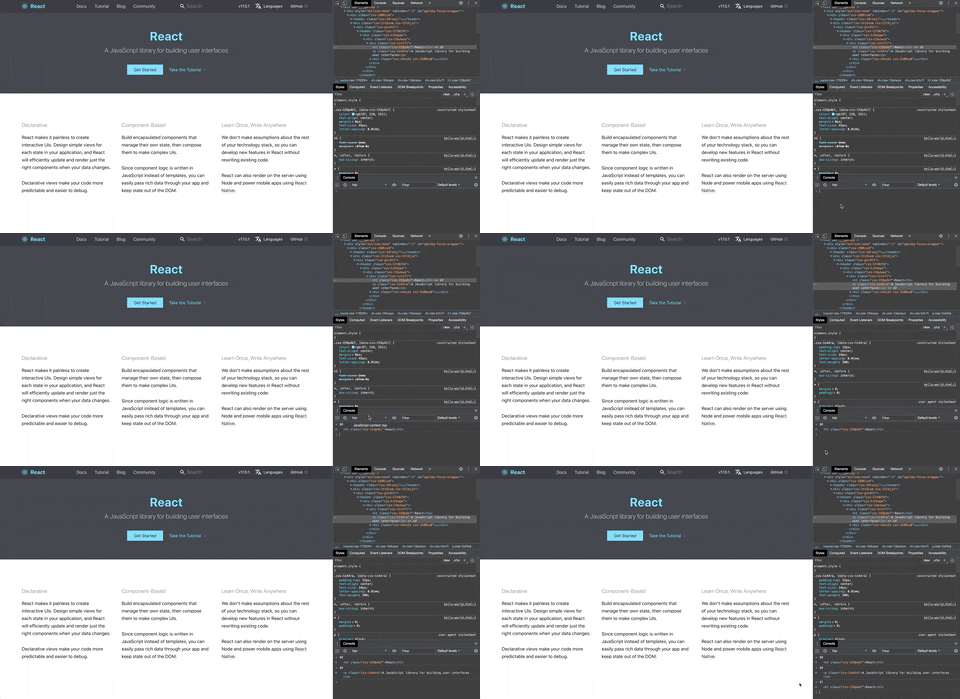
Access recently selected elements in console
Sometimes we need access to DOM elements in the console so that we can inspect
various properties or behavior. Chrome provides a quick shortcut to access these
elements within the console. If you type $0 into the console, you will get the
element you most recently interacted with in the Elements tab. If you type in
$1, you will get the second most recent element you interacted with, and so
forth...
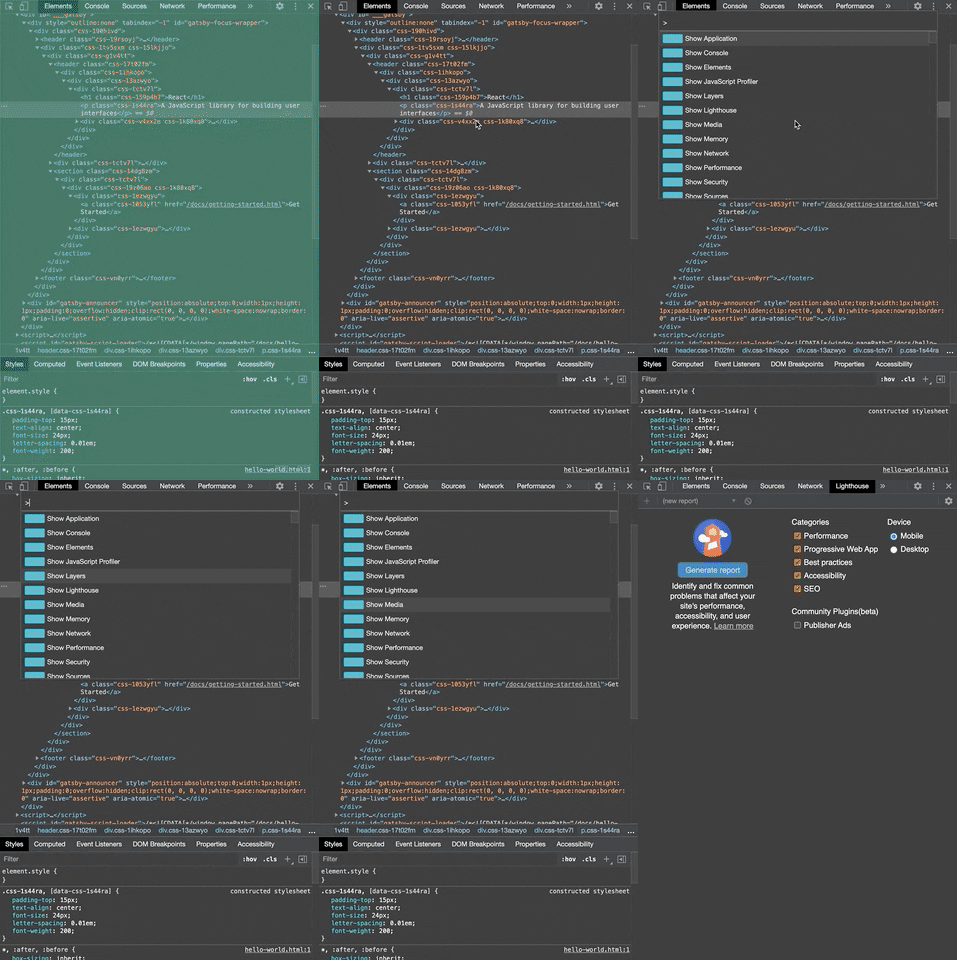
Run commands
By pressing command + shift + p, you can search dev tools for nearly
anything and quickly
run various commands.
This gives you extremely quick access to many features of the dev tools. Give
this one a try, you may find something you didn't know existed.
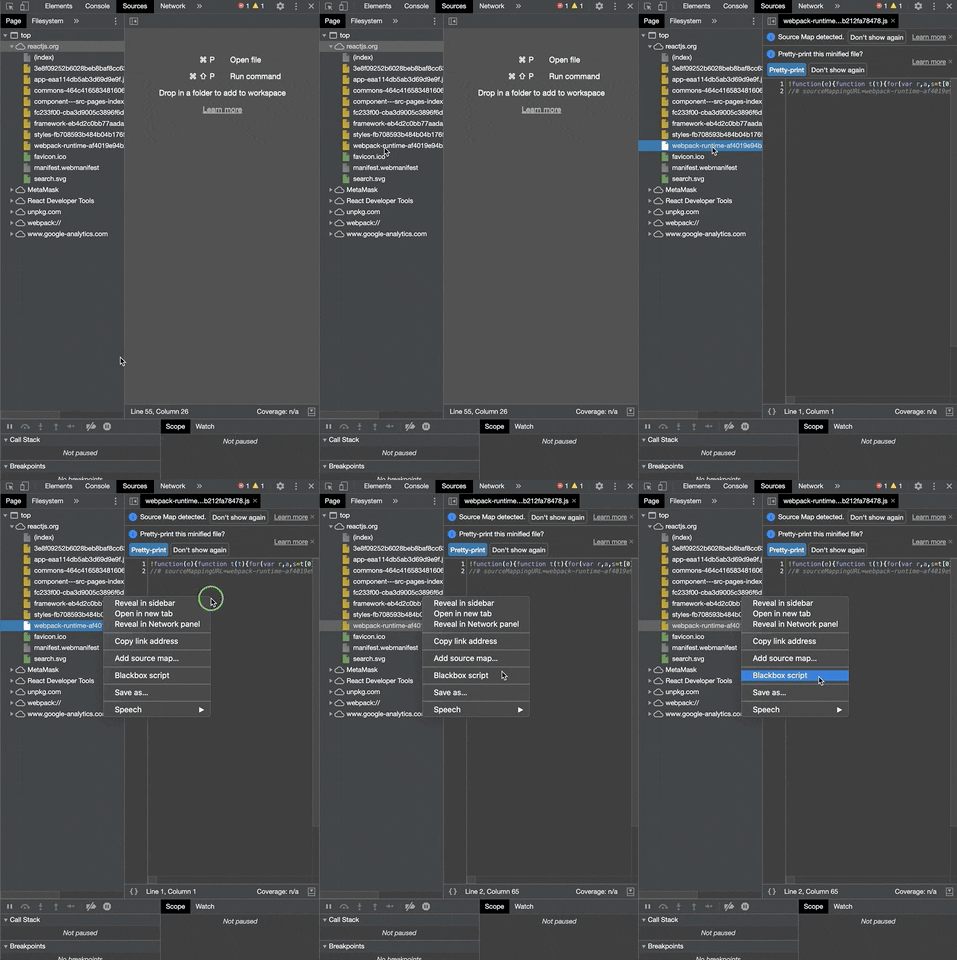
Blackbox scripts
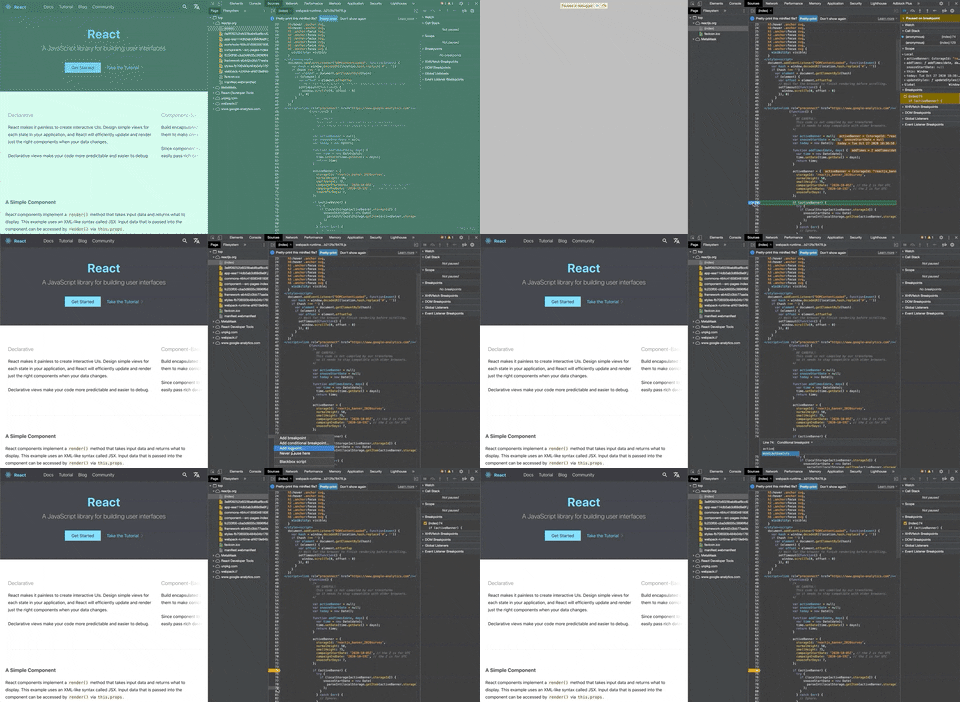
Ever get stuck debugging in some random runtime file that you never wanted to be in? Blackboxing scripts is your new friend. If there is a script that you do not want your debugger to go into, you can right-click it and select "Blackbox script". Easy enough.
Conditional breakpoints
If you have used the debugger in the dev tools before, you are likely aware that you can set breakpoints to pause your code execution. In addition to your standard breakpoint, Chrome allows you to also set conditional breakpoints. This allows you to specify that a variable must have a certain value in order for the breakpoint to hit. This can be very convenient when you are trying to debug an issue where a particular value must be present. To set a conditional breakpoint, right-click the line you want to set it at and click "Add conditional breakpoint..."
Networking calls: Who called what?
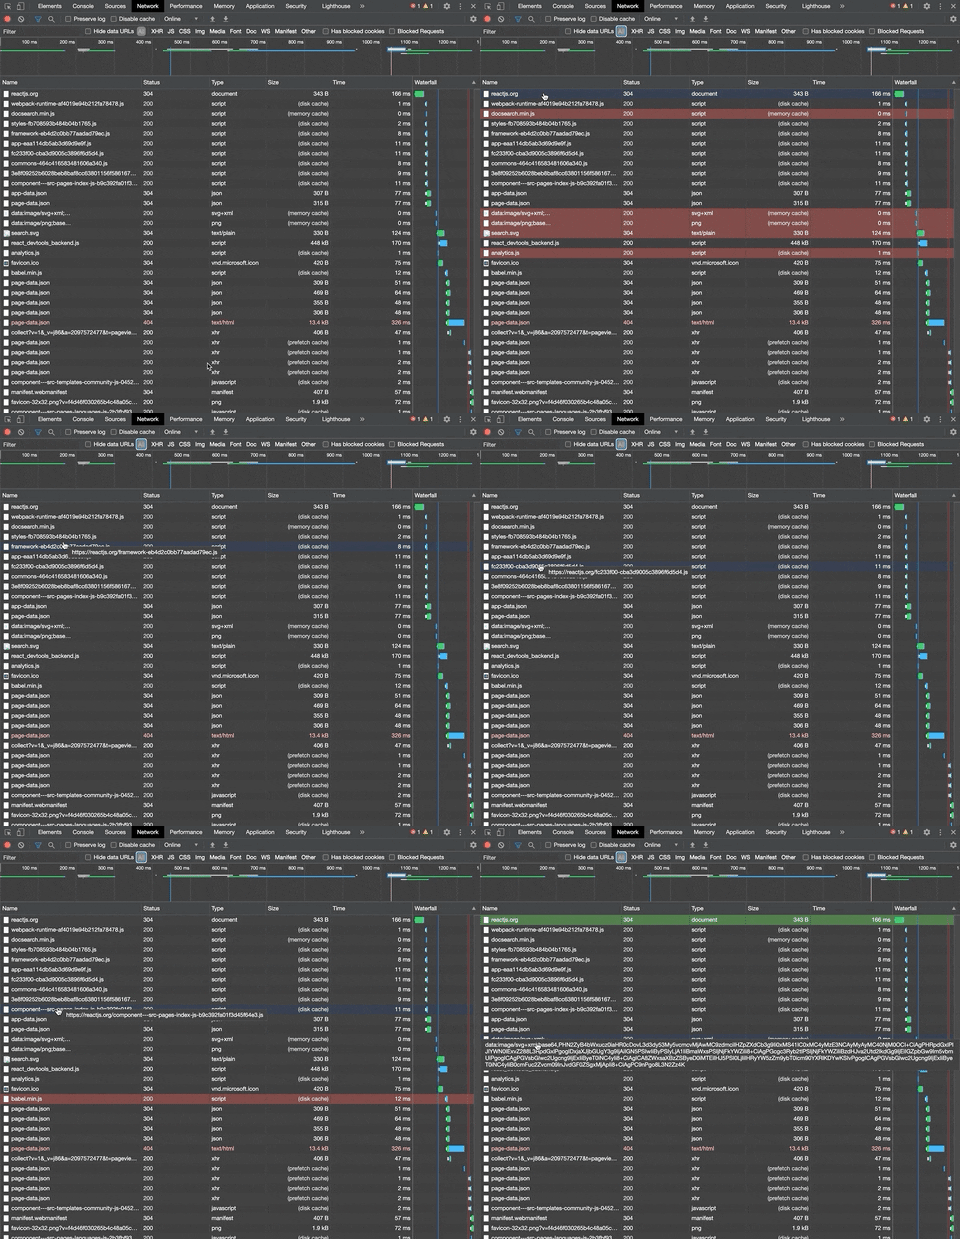
Sometimes we see network calls in the
Network
tab and we're not sure where they came from. Chrome has a neat trick that shows
you if one network call was initiated by another call and if that network call
in turn has dependencies of its own. To take a look, simply hold shift while
hovering a network call. Initiators are colored green and dependencies are
colored red.
Select multiple networking request types
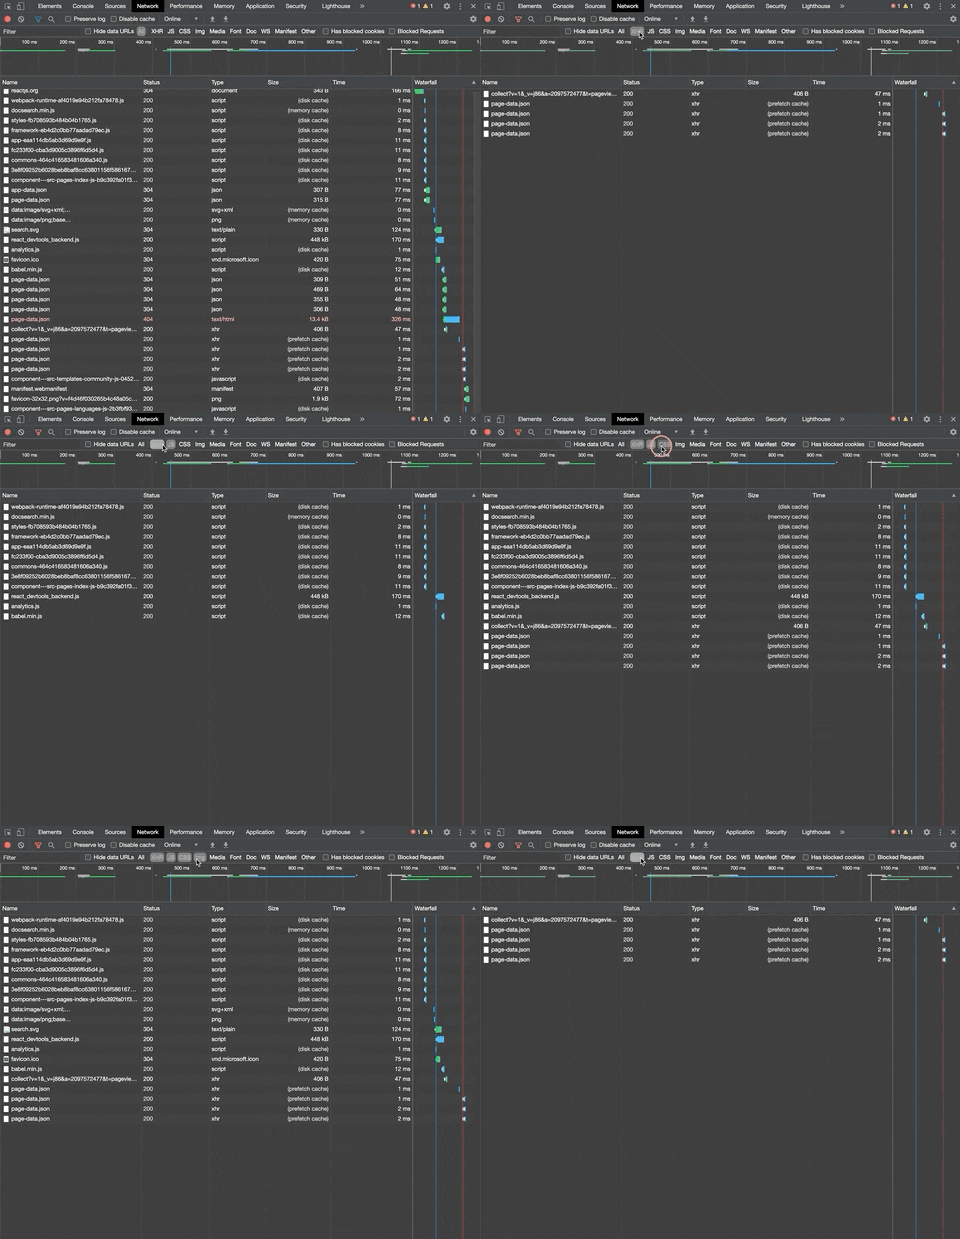
If you are familiar with the Network tab, you are likely aware that you can
select a certain type of network request to filter your results, e.g. XHR. But
maybe you are interested in both XHR and JS requests. By holding command and
clicking different request types, you can select multiple types of requests at
once.
Wrapping up
The Chrome Dev Tools are seriously impressive. These tips are just the tip of the iceberg. The deeper you dive into what features are available to you, the more amazed you will be. The documentation is a great reference. If you are more of a visual learner, I would recommend the Mastering Chrome Dev Tools on Frontend Masters by Jon Kuperman.
Thanks for reading, I hope you learned something!
If you enjoyed this post or found it useful, please consider sharing it on Twitter.
If you want to stay updated on new posts, follow me on Twitter.
If you have any questions, comments, or just want to say hello, send me a message.
Thanks for reading!